Measurement is King of the Web. There are a many tools to monitor individual website activity which track visits, visit time, pages visited, page stay time,widgets used, search engines used, visits by category & tag, etc, etc. At the same time, these tools are tracking how well users are served with page response time, widget delivery plus charting error conditions. Measuring Website performance is a big business.
There are a variety of APM-Application Performance Monitoring services. Most on the list are geared to enterprise applications across several programming languages, Cloud environs, even devices. However, there is a second tier of tools like Atatus, New Relic, and Google Analytics which are middle range players that cover many of the new JavaScript frameworks plus core CMS tools like Drupal, Joomla, and WordPress. Like the enterprise tools, extensive monitoring and statistical chart and report writing features are available. Typical pricing depends on the server configuration being monitored and range from $25/month to $300/month or more.
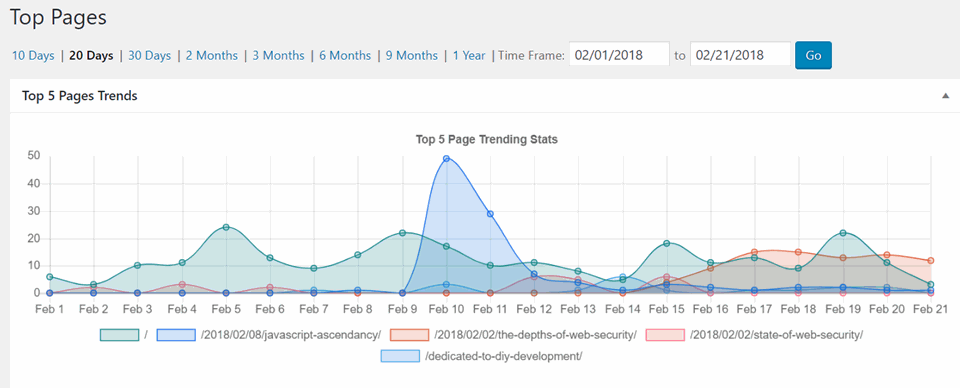
For WordPress users there a number of statistics and monitoring plugins that are priced right – free for a strong core of services. Jetpack, Yoast for Google Analytics, and WPStatistics are three excellent tools. Here is WPStatistics in action graphically reporting on page usage:
 This is very useful information on how well some important reviews are being received by clients and what follow-up promotions should be done.
When I did a survey of the 517 CSI websites, a small subset questionnaire asked how many web owners tracked their websites usage statistics. To my surprise almost 1/2 did not despite the fact that such tracking was available to them for free in the CMS and Web Builder tools they were using. So now one of the first things checked when doing a website update is what measurements are available that profile how the site has been performing. Then I can use a wide range of external apps that allow seeing how well a website is working from the outside.
Outside Measuring Apps
If a website has no monitoring apps installed internally, it is time to call in the external apps that can at least provide reliable information on how a website is currently performing. The good news is that there is a pretty wide selection of free tools that fill in the gaps. We shall look at three measurement categories: speed & performance apps, overall, and web security measures.
Speed & Performance Measuring Apps
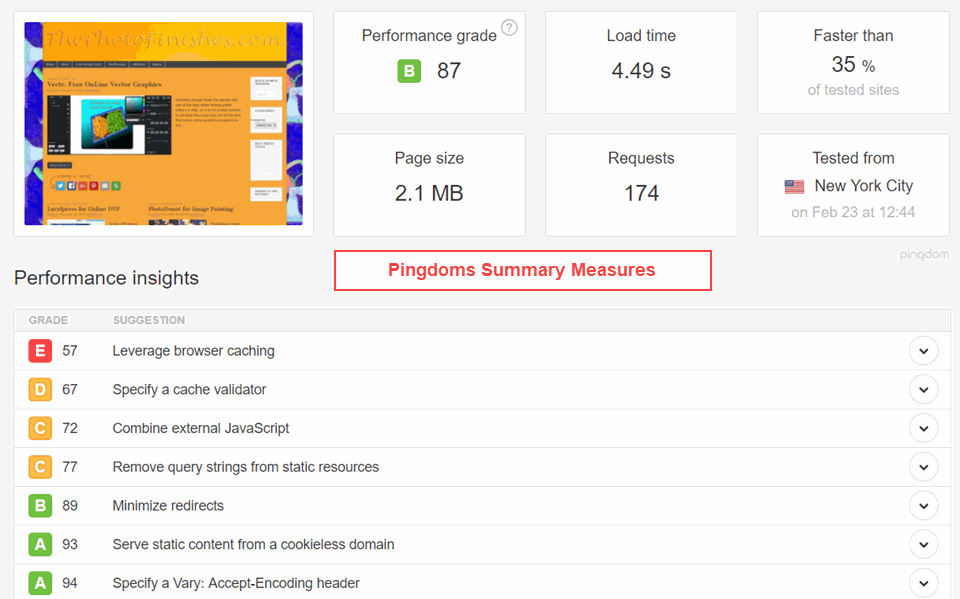
Gtmetrix and Pingdom are two free apps that have been vying for top spot in measuring and helping diagnose webpage load times. Here is Pingdom’s Summary report for my photofinishing blog:
 Now there are several detail page-load analyses provided which fill in the blanks on what is happening during page load. But as a developer I really appreciate the summary report because it indicates in what areas added effort should be applied. Then the detail timeline info quickly suggests where performance tinkering can be most profitably done. A nice extra with Pingdom is that users can decide the location of the test server.
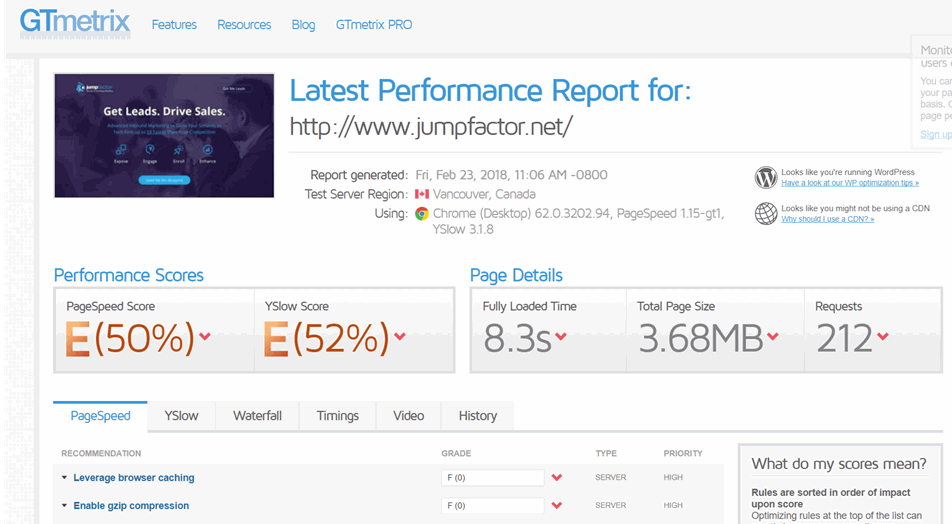
Gtmetrix provides a similar summary report and uses two methods to analyze the results:
 Gtmetrix also provides several pages of detailed analyses including a visual timeline of the page loading of all the objects and scripts used on a page. For example, the page above 3.7MB in size well above the Web average of 2,1MB which clearly impacts pageload performance. Clicking on the Waterfall tab will show the timeline and where loading gets slowed down. The Yslow tab provides additional insights and suggestions where performance can be improved.
There are other tools for performance tuning but these two free tools get users very well started. Each has premium services that can certainly help in a pinch.
Overall Website Grade Tools
Often using the free website grading tools like Website.Grader provide quick overall insights into how well a website is built and working.